The Community Technology Preview (CTP) Version of MS SQL Server 2011 also know as 'Denali' is now available for download.
This is available in both 32 bit and 64 bit versions.
Click here to download CTP1 version of Denali.
To read about what's new in SQL Server 2011 code-named "Denali" - Community Technology Preview 1 (CTP1) click here.


Wednesday, November 10, 2010
Wednesday, October 27, 2010
Microsoft SQL Server 2008 Service Pack 2
Microsoft SQL Server 2008 Service Pack 2 (SP2) is now available for download. These packages may be used to upgrade any edition of SQL Server 2008. Service Pack 2 contains updates for SQL Server Utility, Data-Tier Application (DAC), as well as integration capability for Microsoft Reporting Services with the Microsoft SharePoint 2010 Technologies.
Service Pack 2 introduces support for a maximum of 15,000 partitions in a database, and includes SQL Server 2008 SP1 Cumulative Update 1 to 8.
To Continue reading and Download SQL Server 2008 Service Pack 2 Click Here.
To get the list of bugs that are fixed in SQL Server 2008 Service Pack 2 Click Here.
Service Pack 2 introduces support for a maximum of 15,000 partitions in a database, and includes SQL Server 2008 SP1 Cumulative Update 1 to 8.
To Continue reading and Download SQL Server 2008 Service Pack 2 Click Here.
To get the list of bugs that are fixed in SQL Server 2008 Service Pack 2 Click Here.
Tuesday, October 12, 2010
SQL Server System Views Map
The Microsoft SQL Server System Views Map shows the key system views included in SQL Server, and the relationships between them.
This Map can be downloaded from the links below.
SQL Server 2008 System Views Map
This Map can be downloaded from the links below.
SQL Server 2008 System Views Map
http://www.microsoft.com/downloads/en/details.aspx?FamilyID=531c53e7-8a2a-4375-8f2f-5d799aa67b5c&displaylang=en
SQL Server 2005 System Views Map
SQL Server 2005 System Views Map
Monday, October 4, 2010
Combining Profiler and Perfmon Data
For troubleshooting Performance issue on a SQL Server, profiler and perfmon plays a major role.
By combining both the data, the analysis will be very much easy as we can track the queries which are causing the issue at that part of time.
Here is how we can combine both the data.
To do this, we have to make sure that both the log files are time synched. This is Very Much Important for combining the 2 log files.
First create a perfmon log file by accessing the performance monitor.
1.Click on “Run” and type “perfmon” and click “ok” to open the performance monitor.
2.Create a data collector set with the required counters.
3.Note down the data collector set name and close.
Now to make both the log files time synced, I have created 6 Jobs.
1. “DBA - Start Perfmon” to start the perfmon from a SQL Job using operating system command.
2. “DBA - Stop Perfmon” to stop the perfmon from a SQL Job using operating system command.
3. “DBA - Start Tracing SQL Server” to start the SQL Profiler using the T-SQL Commands.
4. “DBA - Stop Tracing SQL Server” to stop the SQL Profiler using the T-SQL Commands.
5. “DBA - Start Perfmon and SQL Trace” to start both the perfmon and Profiler jobs.
6. “DBA - Stop Perfmon and SQL Trace” to start both the perfmon and Profiler jobs.
The first 4 jobs are called by the 5th and 6th job to make sure that both the log files are in time synced.
Once you create the jobs, make sure to do the below changes.
1. Change the Data Collector Set Name in “DBA - Start Perfmon” and “DBA - Stop Perfmon”

2. Change the Trace file path in the job “DBA - Start Tracing SQL Server”
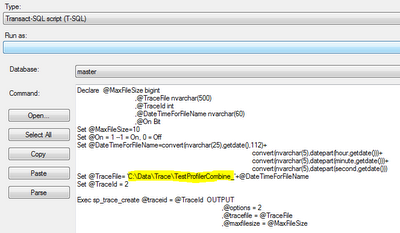
3. Add or remove any events as required in the job “DBA - Start Tracing SQL Server”
Once you have done all these changes, now start the job “DBA - Start Perfmon and SQL Trace” which in turn starts the jobs “DBA - Start Perfmon” and “DBA - Start Tracing SQL Server” and captures the data in the respective log files.
After an ample amount of time when you feel that the captured data is enough for your analysis then, start the job “DBA - Stop Perfmon and SQL Trace” which in turn starts the jobs “DBA - Stop Perfmon” and “DBA - Stop Tracing SQL Server” and stops capturing the data.
Once you get the log files,
1. Start SQL Profiler and open the SQL trace file (.trc file) in it.
2. Wait until the SQL Trace file is fully loaded.
3. Then go to File -> Import Performance Data.
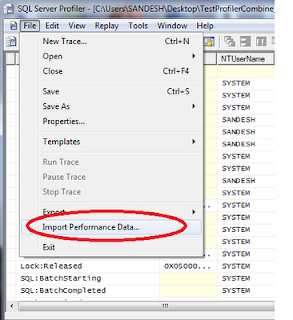
4. Choose the Perfmon log file (.BLG, .CSV).

5. A dialog will open asking you to select the counters you would like to display. Select the required Counters and click OK.

6. Now you should get a screen looking similar to the below one.

Thursday, September 30, 2010
Report Login Failures
It sometimes become very critical in some environments that there are a huge login failures and needs to be reported to take appropriate action. To accommodate this type of situations, I have developed a stored proc which gives a report of Failed Login attempts in a specified Time Frame.
This SP expects a parameter @TimeInMin which has a default value of 15 Minutes.
When there are no failures reported then the output will be:


This SP expects a parameter @TimeInMin which has a default value of 15 Minutes.
Create Proc ReportLoginFailure (@TimeinMin int =15)
As
/*
Author :Sandesh Segu
Purpose :To report the failed loing attempts if any in given
range of time.
Version :1.0
More Scripts :http://sanssql.blogspot.com
*/
Declare @Count int
Create Table #ErrorLog
(ErrorLoggedDate DateTime,
ProcessInfo nvarchar(50),
ErrorText nvarchar(1000))
Insert into #ErrorLog exec sp_readerrorlog
Select @Count=Count(*) from #ErrorLog where ErrorText like 'Login failed for user%'
and datediff(Minute,ErrorLoggedDate,getdate())<=@TimeinMin
If @Count>0
Begin
Select Report=Cast(@Count As Varchar)+' Login Failures Reported in past '+Cast (@TimeinMin As varchar)+' Minutes.'
Select * from #ErrorLog where ErrorText like 'Login failed for user%'
and datediff(Minute,ErrorLoggedDate,getdate())<=@TimeinMin
End
Else
Select Report='No Login Failures Reported in the Specified Time Frame.'
Drop table #ErrorLog
GO
/*
Usage: Specify the time limit parameter in minutes for the SP. Default is 15 mins.
Exec ReportLoginFailure 600
*/
When there are no failures reported then the output will be:
When there are failures reported then the output will be:
Subscribe to:
Posts (Atom)