SansSQL

Tuesday, October 12, 2010

SQL Server System Views Map

The Microsoft SQL Server System Views Map shows the key system views included in SQL Server, and the relationships between them. 
This Map can be downloaded from the links below.


SQL Server 2008 System Views Map

Monday, October 4, 2010

Combining Profiler and Perfmon Data

For troubleshooting Performance issue on a SQL Server, profiler and perfmon plays a major role.
By combining both the data, the analysis will be very much easy as we can track the queries which are causing the issue at that part of time.

Here is how we can combine both the data.

To do this, we have to make sure that both the log files are time synched. This is Very Much Important for combining the 2 log files.

First create a perfmon log file by accessing the performance monitor.
     1.Click on “Run” and type “perfmon” and click “ok” to open the performance monitor.
     2.Create a data collector set with the required counters.
     3.Note down the data collector set name and close.

Now to make both the log files time synced, I have created 6 Jobs.
     1. “DBA - Start Perfmon” to start the perfmon from a SQL Job using operating system command.
     2. “DBA - Stop Perfmon” to stop the perfmon from a SQL Job using operating system command.
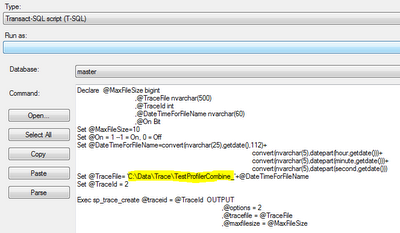
     3. “DBA - Start Tracing SQL Server” to start the SQL Profiler using the T-SQL Commands.
     4. “DBA - Stop Tracing SQL Server” to stop the SQL Profiler using the T-SQL Commands.
     5. “DBA - Start Perfmon and SQL Trace” to start both the perfmon and Profiler jobs.
     6. “DBA - Stop Perfmon and SQL Trace” to start both the perfmon and Profiler jobs.
The first 4 jobs are called by the 5th and 6th job to make sure that both the log files are in time synced.
You can download the scripts for these jobs from here.
Once you create the jobs, make sure to do the below changes.
     1. Change the Data Collector Set Name in “DBA - Start Perfmon” and “DBA - Stop Perfmon”


     2. Change the Trace file path in the job “DBA - Start Tracing SQL Server” 

 3. Add or remove any events as required in the job “DBA - Start Tracing SQL Server”


Once you have done all these changes, now start the job “DBA - Start Perfmon and SQL Trace” which in turn starts the jobs “DBA - Start Perfmon” and “DBA - Start Tracing SQL Server” and captures the data in the respective log files.


After an ample amount of time when you feel that the captured data is enough for your analysis then, start the job “DBA - Stop Perfmon and SQL Trace” which in turn starts the jobs “DBA - Stop Perfmon” and “DBA - Stop Tracing SQL Server” and stops capturing the data.


Once you get the log files,
1. Start SQL Profiler and open the SQL trace file (.trc file) in it.
2. Wait until the SQL Trace file is fully loaded.
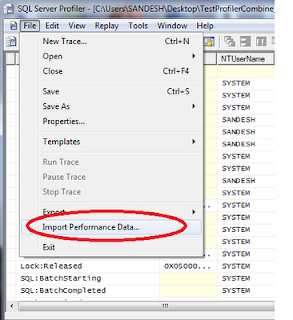
3. Then go to File -> Import Performance Data.

4. Choose the Perfmon log file (.BLG, .CSV).


5. A dialog will open asking you to select the counters you would like to display. Select the required Counters and click OK.

6. Now you should get a screen looking similar to the below one.

This article is also available in pdf format for downloading.
Please Click here to get your copy.

Thursday, September 30, 2010

Report Login Failures

It sometimes become very critical in some environments that there are a huge login failures and needs to be reported to take appropriate action. To accommodate this type of situations, I have developed a stored proc which gives a report of Failed Login attempts in a specified Time Frame.
This SP expects a  parameter @TimeInMin which has a default value of 15 Minutes.


Create Proc ReportLoginFailure (@TimeinMin int =15)
As
/*
Author            :Sandesh Segu
Purpose           :To report the failed loing attempts if any in given 
                   range of time.
Version           :1.0
More Scripts      :http://sanssql.blogspot.com
*/

Declare @Count int
Create Table #ErrorLog
(ErrorLoggedDate DateTime,
ProcessInfo nvarchar(50),
ErrorText nvarchar(1000))

Insert into #ErrorLog exec sp_readerrorlog

Select @Count=Count(*) from #ErrorLog where ErrorText like 'Login failed for user%'
and datediff(Minute,ErrorLoggedDate,getdate())<=@TimeinMin

If @Count>0
      Begin
            Select Report=Cast(@Count As Varchar)+' Login Failures Reported in past '+Cast (@TimeinMin As varchar)+' Minutes.'
            Select * from #ErrorLog where ErrorText like 'Login failed for user%'
            and datediff(Minute,ErrorLoggedDate,getdate())<=@TimeinMin
      End
Else
      Select Report='No Login Failures Reported in the Specified Time Frame.'

Drop table #ErrorLog
GO

/*
Usage: Specify the time limit parameter in minutes for the SP. Default is 15 mins.
Exec ReportLoginFailure 600
*/


When there are no failures reported then the output will be:


When there are failures reported then the output will be:


Saturday, September 25, 2010

SQL Server 2008 Certification path

For those who are interested in SQL Server 2008 Certification, download the pdf from the below link. This reference pdf is self explanatory and gives the complete list of certifications  that needs to be completed by an individual to gain MCTS and MCITP in SQL Server 2008 from Microsoft.

Microsoft SQL Server 2008 Certification Paths


Monday, September 13, 2010

Schema Changes History Report in SQL Server 2008

In one of my previous posts "Find out who has changed what" I had explained how to find out who has changed what in SQL server when the trace is enabled.

In SQL Server 2008, the Default trace is enabled by default during the installation and this default trace in SQL Server 2008 acts as a Blackbox for the SQL Server. Hence it is also called as "Black Box" in SQL Server 2008 and  the default trace cannot be stopped by using the Query "Exec sp_trace_setstatus 'Trace_id',0 --0 stops the trace " . This has to be stopped using the sp_configure.
To Use this report, Just right Click on the database and choose the option "Reports" and Select "Standard Reports" and choose "Schema Changes History".

To Test this, I executed the below query on AdventureWorks Database. I have also included the Statements "Waitfor Delay" to know the Time Difference.

Use AdventureWorks
Go

Create Table Tbl_TestSchemaChangesHistoryReport
( Id int,
Name Varchar(50))

Waitfor Delay '00:01:00' -- to know the time difference

Alter table Tbl_TestSchemaChangesHistoryReport Add Address_Column varchar(100)

Waitfor Delay '00:01:00' -- to know the time difference

Drop table Tbl_TestSchemaChangesHistoryReport 

And here is the results.

Ads